The Simple Rating System (SRS)
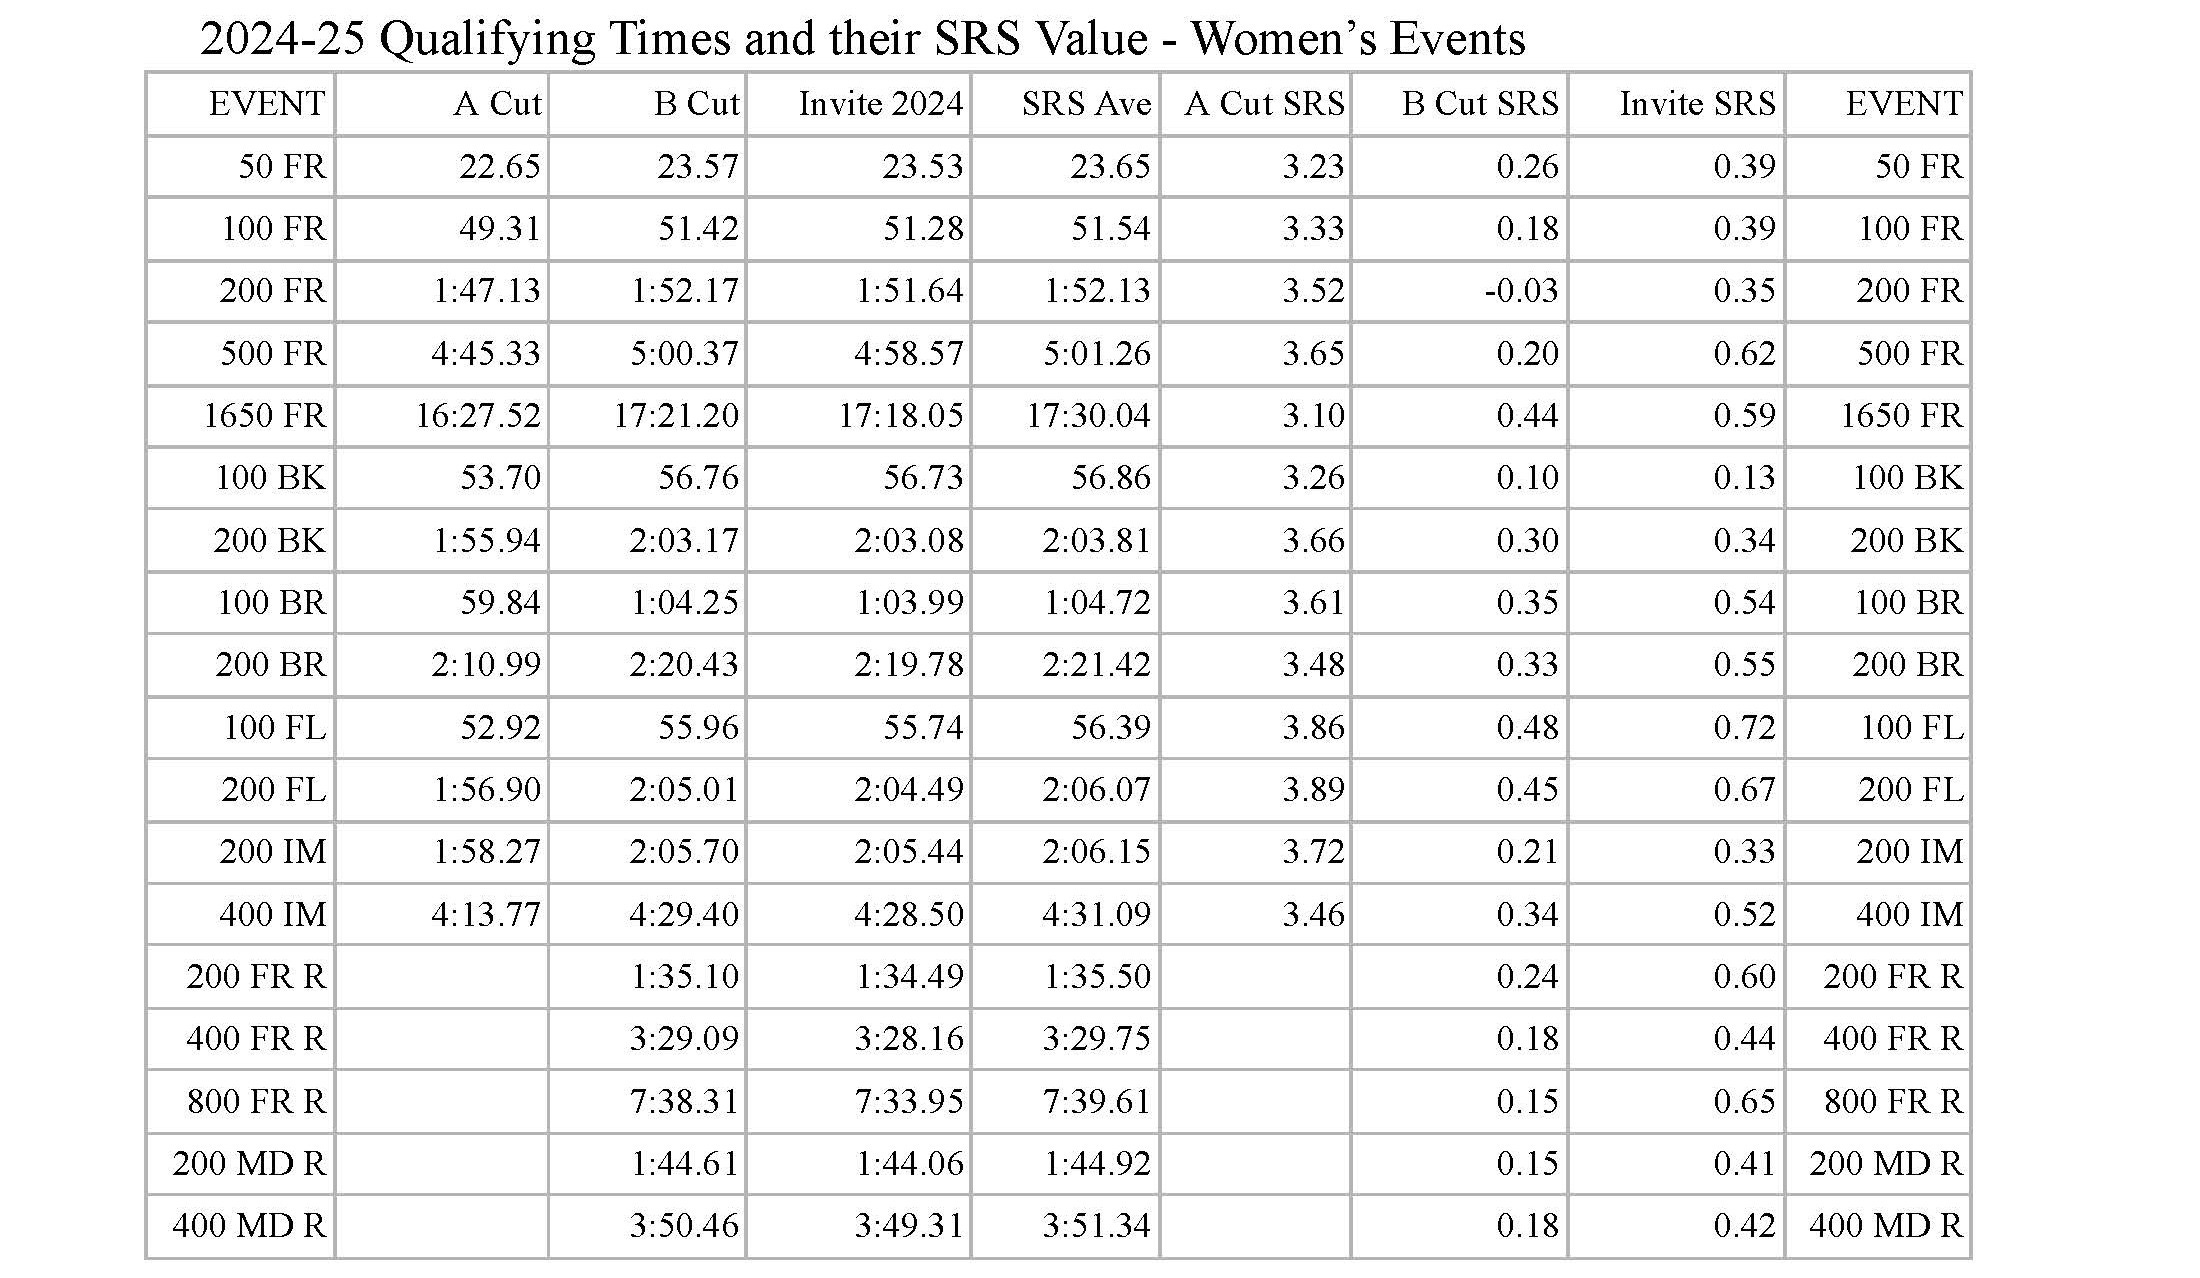
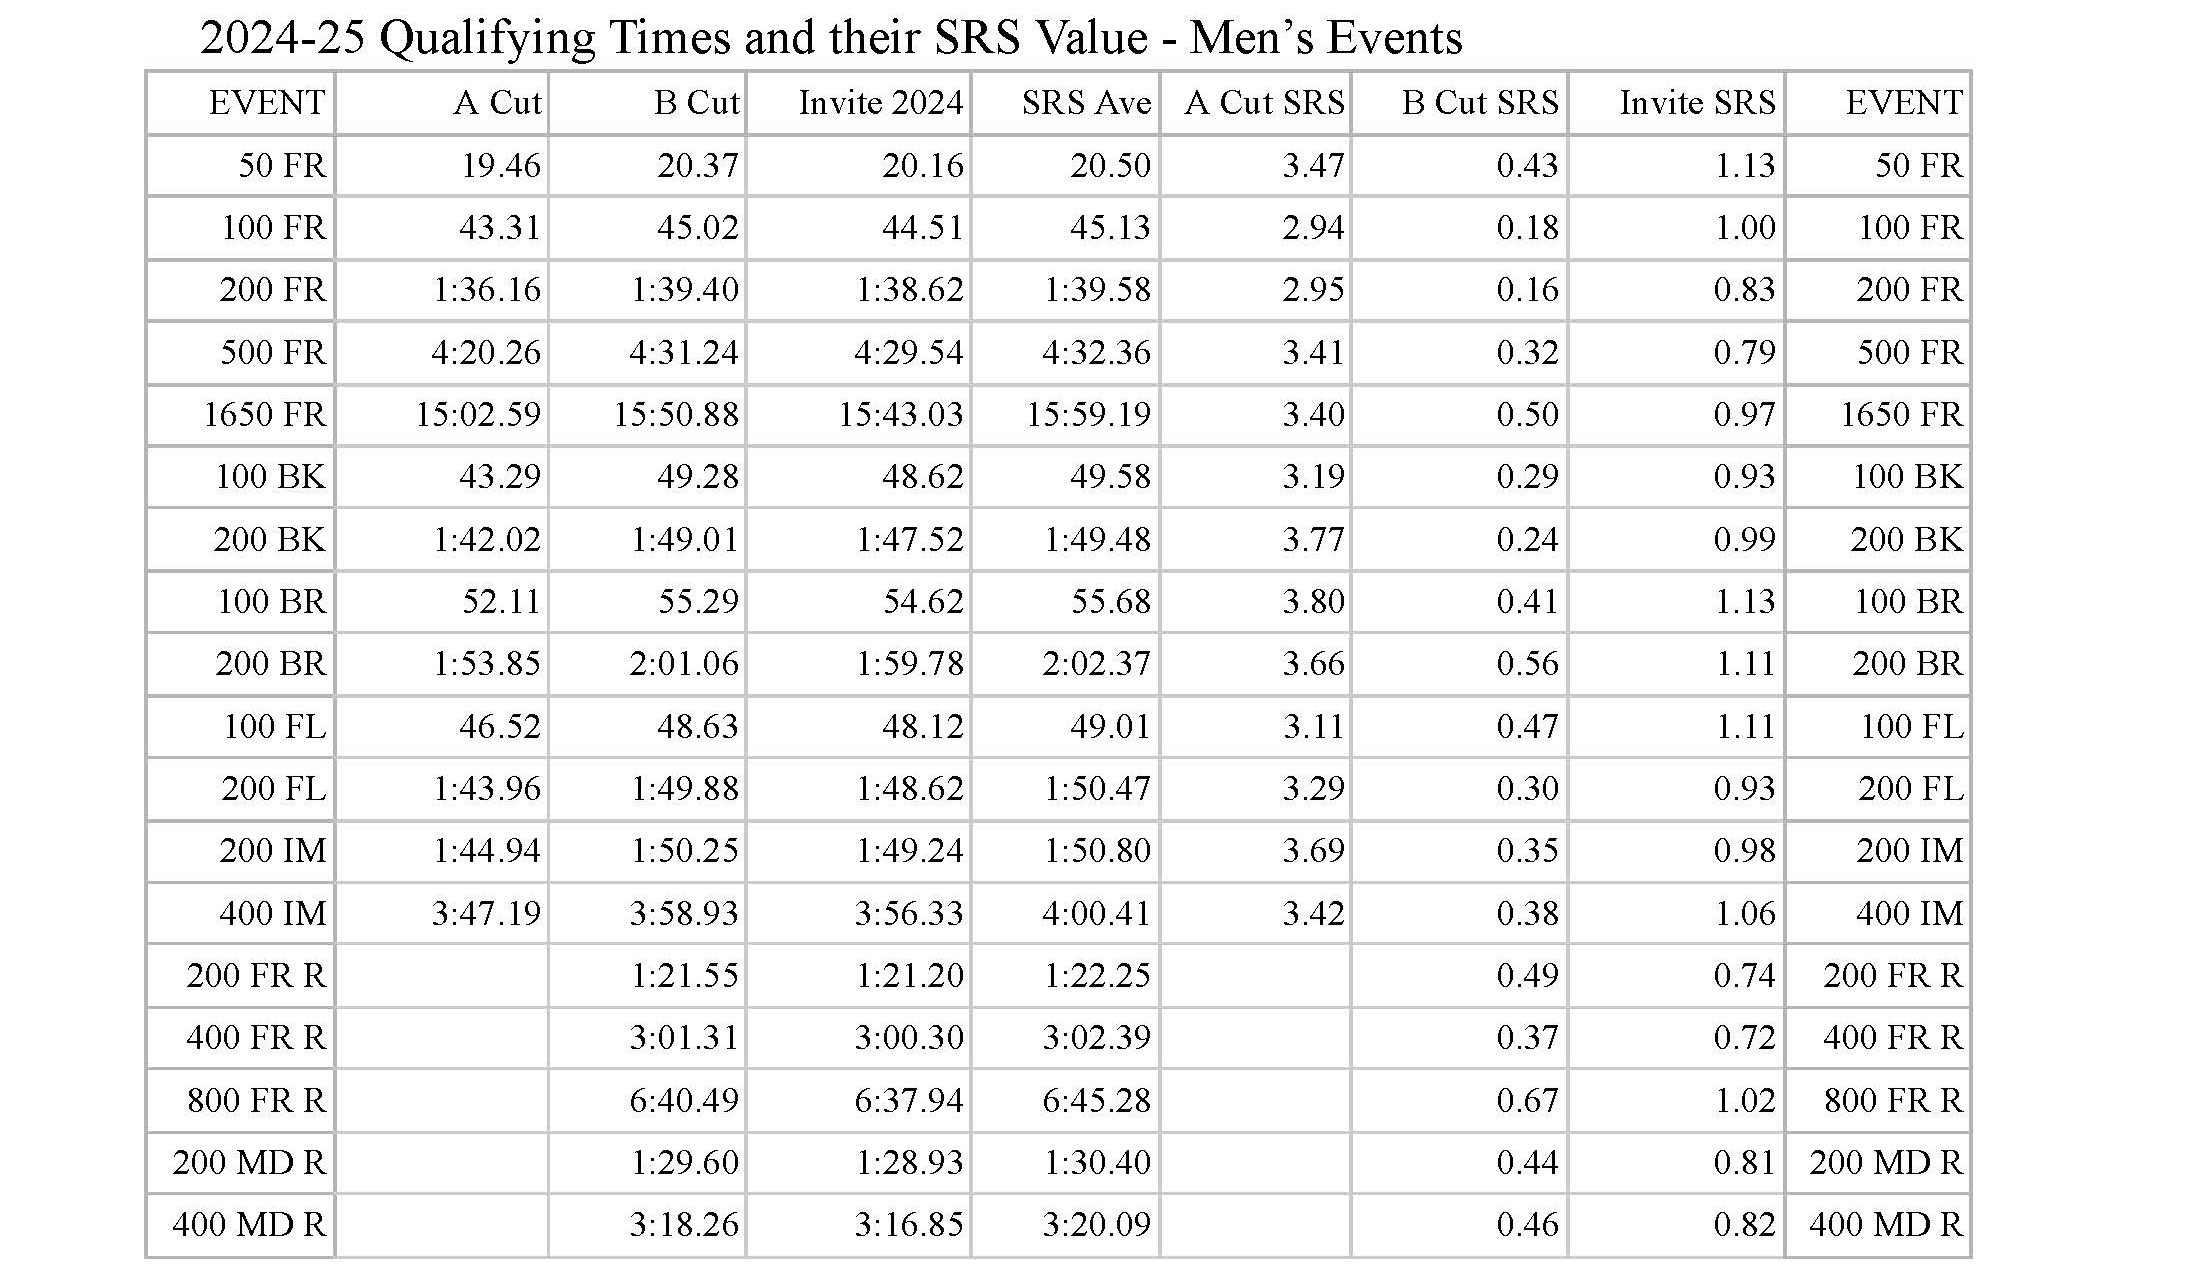
The current SRS tables can be found here.
The goal of the Simple Rating System (SRS) is simple: to create a transparent point system to evaluate swim performances using a measure derived from actual Division III swimming.
Updated SRS Tables for 2024-25, including swims from last season.
The SRS Average is the average of 500 fast swims in an event - the 100 fastest swims in that event from each of the last five full seasons of Division III swimming.
Those seasons are 2017-18, 2018-19, 2021-22, 2022-23, and 2023-24.
We then use a standard distribution model of those times to derive standard deviations.
SRS score is the average time for that event, minus the recorded time of the swim, divided by the standard deviation amount.
If it helps, think of it like deriving a z-score, where z is equal to SRS:
What SRS Can Do
SRS can:
evaluate any swim, comparing it to other fast swims over the past several seasons;
evaluate the value a swimmer is creating that season, by aggregating points across several events;
evaluate the relative strength of teams by aggregating those aggregates (i.e., P.A.D.D.L.E.).1
And the goal is to do this without introducing any extra steps or layers of complexity that requires special knowledge of the history of collegiate and international swimming, or access to proprietary calculations and formulas.
In evaluating athletic performance and the relative strength of teams, SRS also removes the distortions that inevitably arise when metrics are tied to a single outlier - like a Division I NCAA record set by Katie Ledecky or Leon Marchand.
How Does SRS Work?
The average swim and standard deviations2 are the core of the Simple Rating System (SRS).
With any swim (x) you subtract the average for that event,3 and then divide what’s left by the standard deviation, and the result is the number of points assigned to that swim by SRS. Here is an example based on Kaley McIntyre’s 50 Free time at 2023 Nationals, 22.78 seconds.
SRS Average for the event (Women's 50 Free): 23.66
Kaley McIntyre's 50 Free time: 22.78
SRS Standard Deviation for the event (Women's 50 Free): 0.32

23.66 - 22.78 = 0.88
0.88 / 0.32 = 2.75
SRS = 2.75

According to SRS, Ms. McIntyre's swim is worth 2.75 points (a lot).
(This example is from a previous season. The SRS average has since changed.)
If, for some of you, it helps to think of her time in the 50 Free as ‘2.75 standard deviations above average’ that is an appropriate characterization of her SRS score.
0.00 = fast
We should recognize that an SRS score of 0.00 still means that your swim was fast - it was right at the average for the 100 fastest swims per season over the past five full seasons. A swim that scores 0.00 is not an average swim; it is the average swim among a very fast data set. It is the mathematical definition of ‘a fast swim in Division III.’
One practical outcome of using a fast data set is that many athletes with high SRS scores in one event may have a negative SRS score in an event they do not normally swim. They were not ‘slow’ by any normal measure in that ‘off’ event, but SRS standards are high, and athletes who are good sports and swim a lot of different events are likely to have a few negative scores in the mix.
When evaluating where a swimmer ranks going into conference championships or Nationals, it makes sense to limit the number of events used in the calculation. Swimmers can only swim so many events in championship meets and will almost certainly swim only in events where they are strongest.
We cannot give enough credit to the creators of the Anchor Leg Podcast for immediately grasping how this measure could be used to make more interesting predictions of Nationals performances. They also came up with the name, which caught on quite well, and which speaks to their creativity and marketing acuity.
Apologies if many of you find this too rudimentary, but think of standard deviation as a way of standardizing the distance (measured in seconds) between your swim and the average swim in the set.
More specifically, standard deviation is a statistical measure that quantifies the amount of variation or dispersion of a set of data values. It provides an insight into how spread out the data points are from the mean (average) of the data set, in this case the fastest time from the 100 fastest athletes in each event over the past five full seasons.
Again, the average is drawn from a data set of fast swims over the five most recent full seasons.


