Trailing averages and leading edges
Fast swims, faster swims and the erratic nature of outliers
No such thing as ‘an average year’
First, we recognize that there is no such thing as an average year in Division III swimming. It was not just COVID. The trend in Division III swimming is for the field of swimmers to get faster, as a group, every year.
So when we take an average of, say, the top 100 times each year (2011-19 & 2022) for each event, we are aware that we are looking at a trailing average. Meaning, we should expect the average of the current full season to be faster than the average from three seasons ago, which should be faster than the average from three seasons before that.1
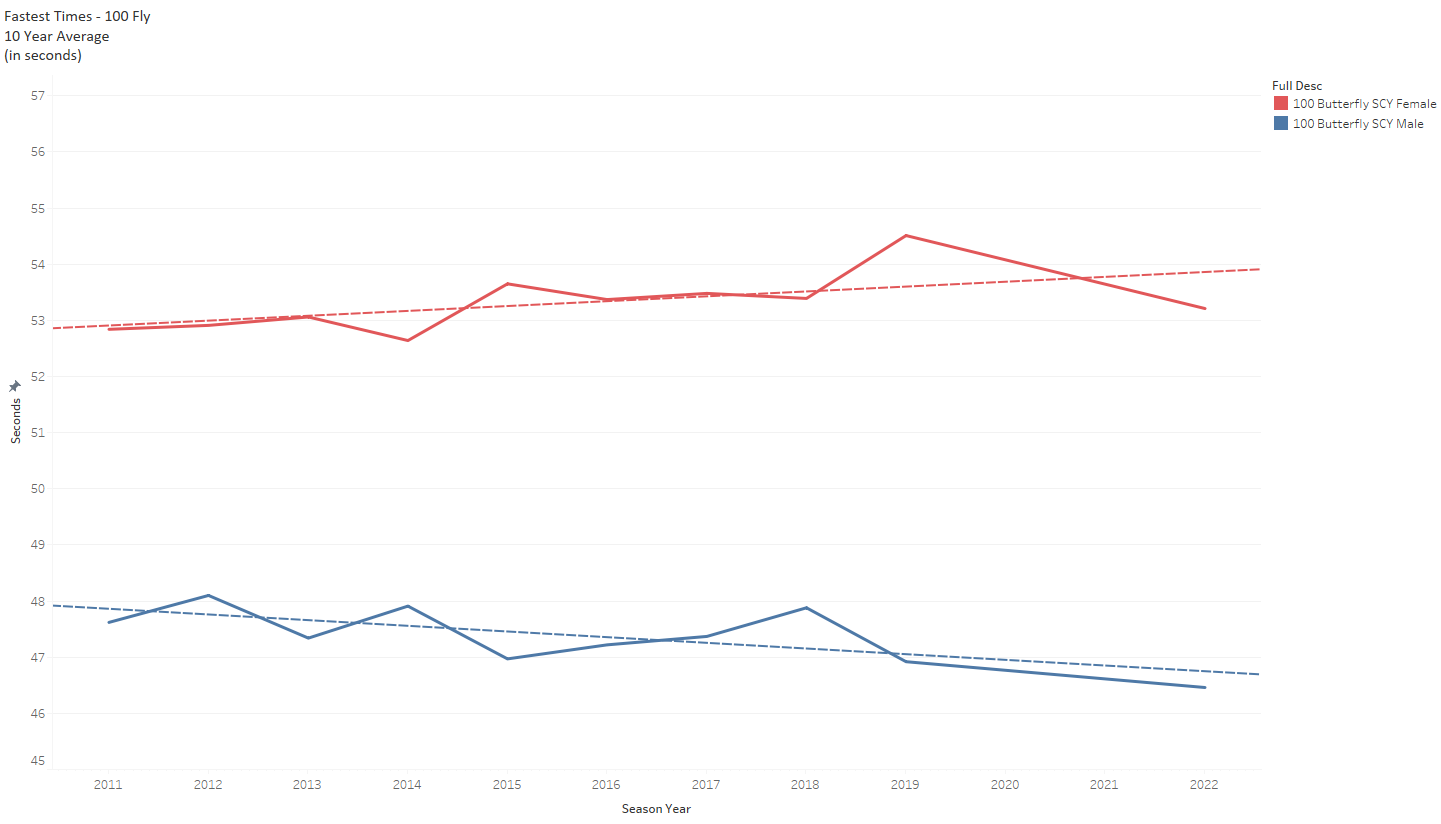
For a visual, here is the general trend in the 100 fastest times per year in Division III in 100 Fly.
But the fastest times are outliers
By definition, the very fastest times are going to be outliers. And outliers do not move with the same predictability as the average of large sets of numbers.
Look at Women’s 100 Fly, for example (table above, Fastest Time, Ten Year Average, 100 Butterfly SCY Female).2 53.31 is a fast time, and it would have won the event 6 of the last ten full seasons.
If outliers moved like large averages, we would guess that (allowing for some noise) 53.31 was fast enough to win in the first six seasons of our 10-year data set, but - because everything is getting faster - we might then guess that 53.31 has been surpassed in all or most of the last four years.
And that is not what happened at all.
Last season’s event winner at Nationals (here’s a familiar name - Crile Hart) went faster than 53.31.
But the fastest time in 2019 wasn’t even close (54.58).
Emma Waddell won the event at Nationals in 2015, 2017, and 2018, yet her fastest time was 53.39.3
And the fastest times recorded in the event were in the stretch of 2012-2014, thanks to Logan Todhunter (53.04 in 2012) and Kirsten Nitz (53.08 in 2013, and a shocking 52.64 in 2014 ).
As you can see from the chart above,4 men’s fastest times (top 1 for the year) are trending down. It is uneven, but you can see the downward trend.5 You can’t say the same about the women’s times in 100 Fly.6
So these average fastest time turns out to be slightly more interesting than we expected. If this year’s winner in Women’s 100 Fly bests 53.31 it will be only the 2nd time that has happened since 2014.
Why 8th fastest? Why 16th fastest?
For the simplest possible reason. The eight fastest times swum in prelims at Nationals qualify for the A Final, and the 9th-16th fastest prelim times swum at Nationals qualify for the B Final.
Note the phrasing ‘swum at Nationals.’ The numbers on the tables are the averages of the fastests, or 8th fastest, or 16th fastest times swum per full season which is not identical to the times swum at Nationals.
But we like the full-season data better than data pulled exclusively from Nationals.
First, we don’t think we are short-changing Nationals. Nationals is the fastest meet of the year and, in most years, most of the 8 fastest times that year - in nearly all events - are swum at Nationals.
Second, we also like the broader sweep of the full season. It embraces the law of large numbers, where a larger data sample drawn from a larger range of instances winds up being more predictive than a smaller data sample drawn from something that feels more directly relevant. Smaller data samples are inferior data samples, even if they seem more specific to the question at hand.7 Limiting the data set to performances at a single meet in a given year would reduce its value, not enhance it.
As always, we are assuming that we are talking about full seasons, so 2011-19 & 2022.
In case it is not clear, 53.31 is the average of ten swims - the fastest swim in that event every year (2011-19, 2022).
In 2016, she DQ’d in the finals, which is painful to consider. It may have been the only thing preventing her from a four year sweep of the event.
In the email, the chart had an erroneous label on the Y axis. It should have just said ‘Seconds.’
The p-value is 0.0336, which feels pretty solid.
If you are interested, the p-value on this is 0.0927. That’s an uncomfortable value to get. For a quick refresher, a p-value <0.05 let’s us reject the null hypothesis. The null hypothesis is that there is no difference between these different populations of swimmers - changing year after year - in terms of their speed, and any trend we think we see in the times they swim is an illusion, just randomness or data error.
Our p-value (0.093) is greater than 0.05, meaning that we don’t get to reject the null hypothesis outright. We have to consider the possibility that we are seeing noise, not a signal. Which would not be a shock. We are talking about a really small sample size. In small samples, random variance tends to swamp everything.
For context, though, consider the p-values for the trends in fastest times in Women’s 100 Free and 200 Free. Both p-values are over 0.60. We are not reporting which direction the trend line is going because, with a p-value over 0.60, the direction doesn’t matter. Any trend you think you see is more-likely-than-not to be a product of randomness.
By the way, there is one event in which there is a trend towards slower times and the p-value is under 0.05. And that event is Women’s 500 Free.
It is a matter for another time, but there is something interesting here. First, Women’s 500 Free is the one event in which the ‘fastest times trend’ is towards slower times over the past decade (or so) and we can reject the null hypothesis on that trend (p-value = 0.0397).
Second, there is one event in which the much larger data set of top 100 fastest times skews (marginally) faster, but which has a p-value of 0.1049. Meaning, we can’t reject the null hypothesis - maybe times are (barely) improving, maybe they are not. That event is Women’s 1650 Free. Keep in mind that in this case we are talking about a much larger data set - the top 100 swims in the event every year for ten years. Getting that p-value of 0.1049 should really give us pause about asserting there is a trend towards faster swims in Women’s 1650 Free.
So, what’s up with women’s distance Free?
A baseball example: if you want to know what a batter is likely to do in the 9th inning of a playoff game, you are better-off looking at averages derived from all plate appearances in all relevant seasons, not just how that player has historically performed in the 9th inning of playoff games. The former data sample is superior because it is larger. When it comes to probability, and thus prediction, larger and diffuse data samples are superior to smaller and specific data samples. They simply do a better job of predicting outcomes.


